Abstract
- An entity used to track time spent by an app processing a request & the status of the request
- Made up one or more Span
- Identify the Span for Latency, then we can carry on with optimisation
Terminologies
Metrics
- Captures request counts, error counts, and latency measures of requests
Runtime Metrics
- Allow to view Heap, non-heap memory usage and Garbage Collector activity of the app
- Datadog can have this enabled with
export DD_RUNTIME_METRICS_ENABLED=true
Instrumented
- Code or tools have been added to the application to monitor, measure, or analyze its behavior during execution
- Provide insights into the application’s performance, functionality, and other operational characteristics
- This is particularly useful for debugging, performance tuning, and monitoring purposes
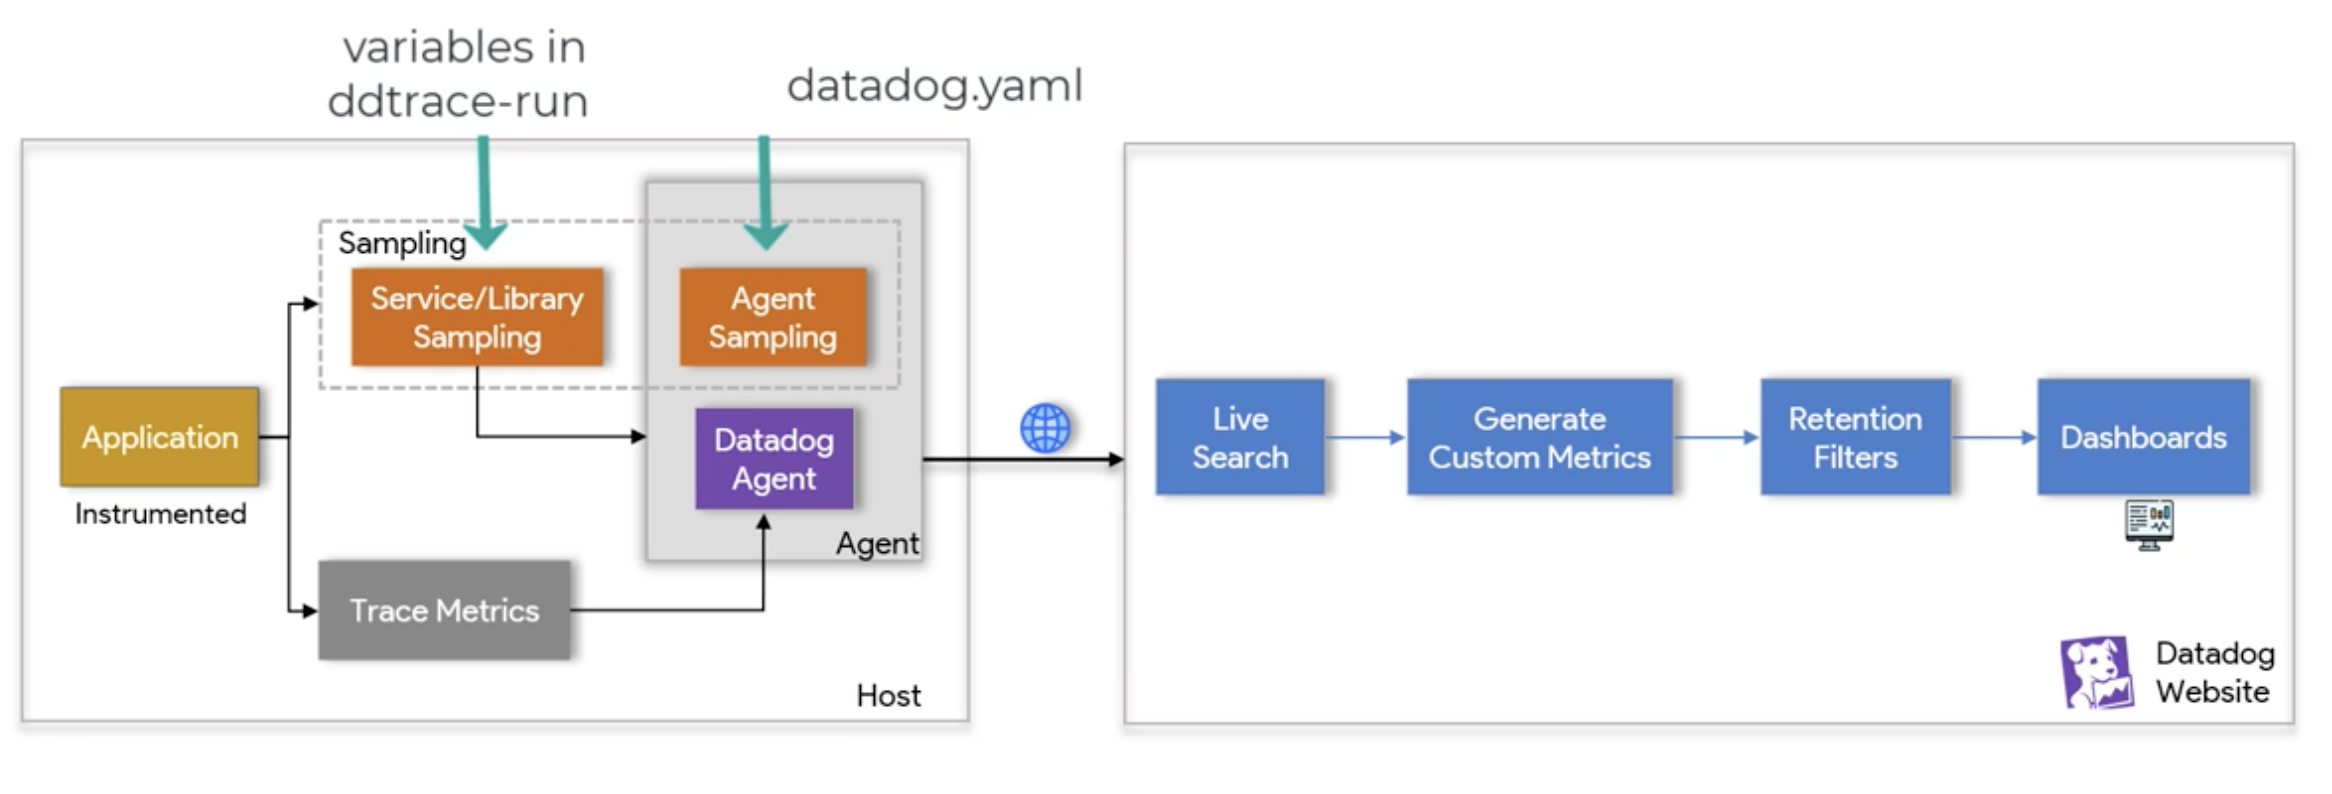
Pipeline
Host-side
- We can tune the Sampling
- Library Sampling overrides Agent Sampling
- Trace Metrics are the Metrics, directly connected Instrumented application, calculated based on 100% of the app’s traffic
Datadog backend side
- Live Search allows us to search Span using any tag or Span
- Generate Custom Metric from Span
- Retention Filters - how long we want to retain the trace
- Dashboard used to give a visual representation of the app for optimisation and debugging