Abstract
Observability vs monitoring
Observability is a broader concept that includes Monitoring. The higher the observability, the faster we can find the root cause when notified of an issue.
Collection methods
Push-based:
- Examples are Datadog and Vector
Pull-based:
- Examples are Prometheus
Cloud environments favor push-based methods for scalability, eliminating the need for centralised polling infrastructure.
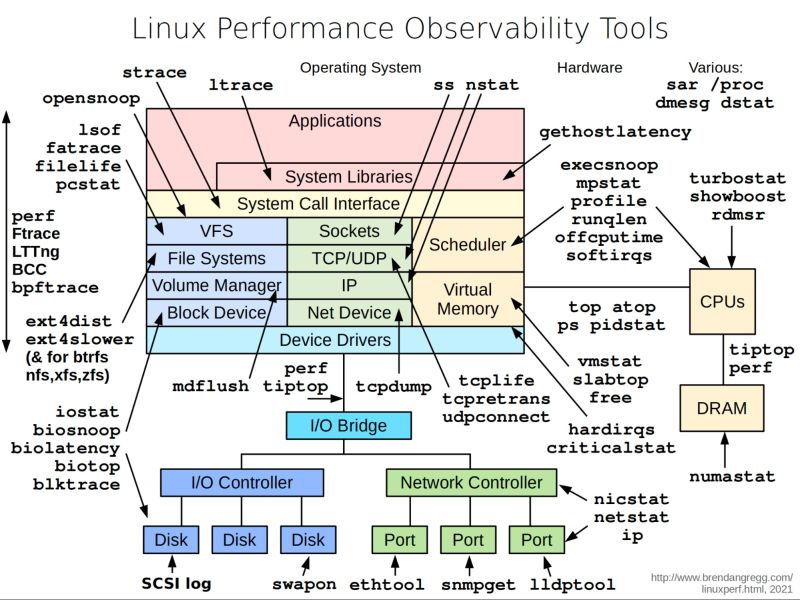
Linux performance observability tools
Metric
- Offer a snapshot of a system’s performance over time
- Collecting different types of metrics helps us gain business insights and understand the system’s health status
Tool
Aggregated Level Metric
- Metric that indicates the top-level health of system by measuring its useful output
- Examples are success rate & error rate
Host Level Metric
- Metric that indicates timely information of physical resources like CPU & Main Memory
- Examples are utilisation
Key Business Metrics
- Daily active users, retention, revenue
Log
- A detailed list of events that occur within the system/application, including when and why they happened
Example
Web server logs, which contain the IP address, date, and time of HTTP request.
Important
Helps to identify errors and problems in the system.
Tool
Log Router

- A tool or service that collects log data from various sources and forwards it to one or more destinations
Important
These tools play a crucial role in centralised logging architectures, especially in environments with multiple applications, services, or systems that generate logs.
Tool
- Fluentd
- Fluent Bit (a lightweight, high-performance log shipper ideal for containerised or edge environments)
- Logstash (part of the ELK Stack)
- AWS FireLens (for Amazon ECS and EKS)

