Abstract
- Query language used to retrieve data from Prometheus’s time series database. Visualisation tools like Grafana use PromQL to create informative dashboards
Important
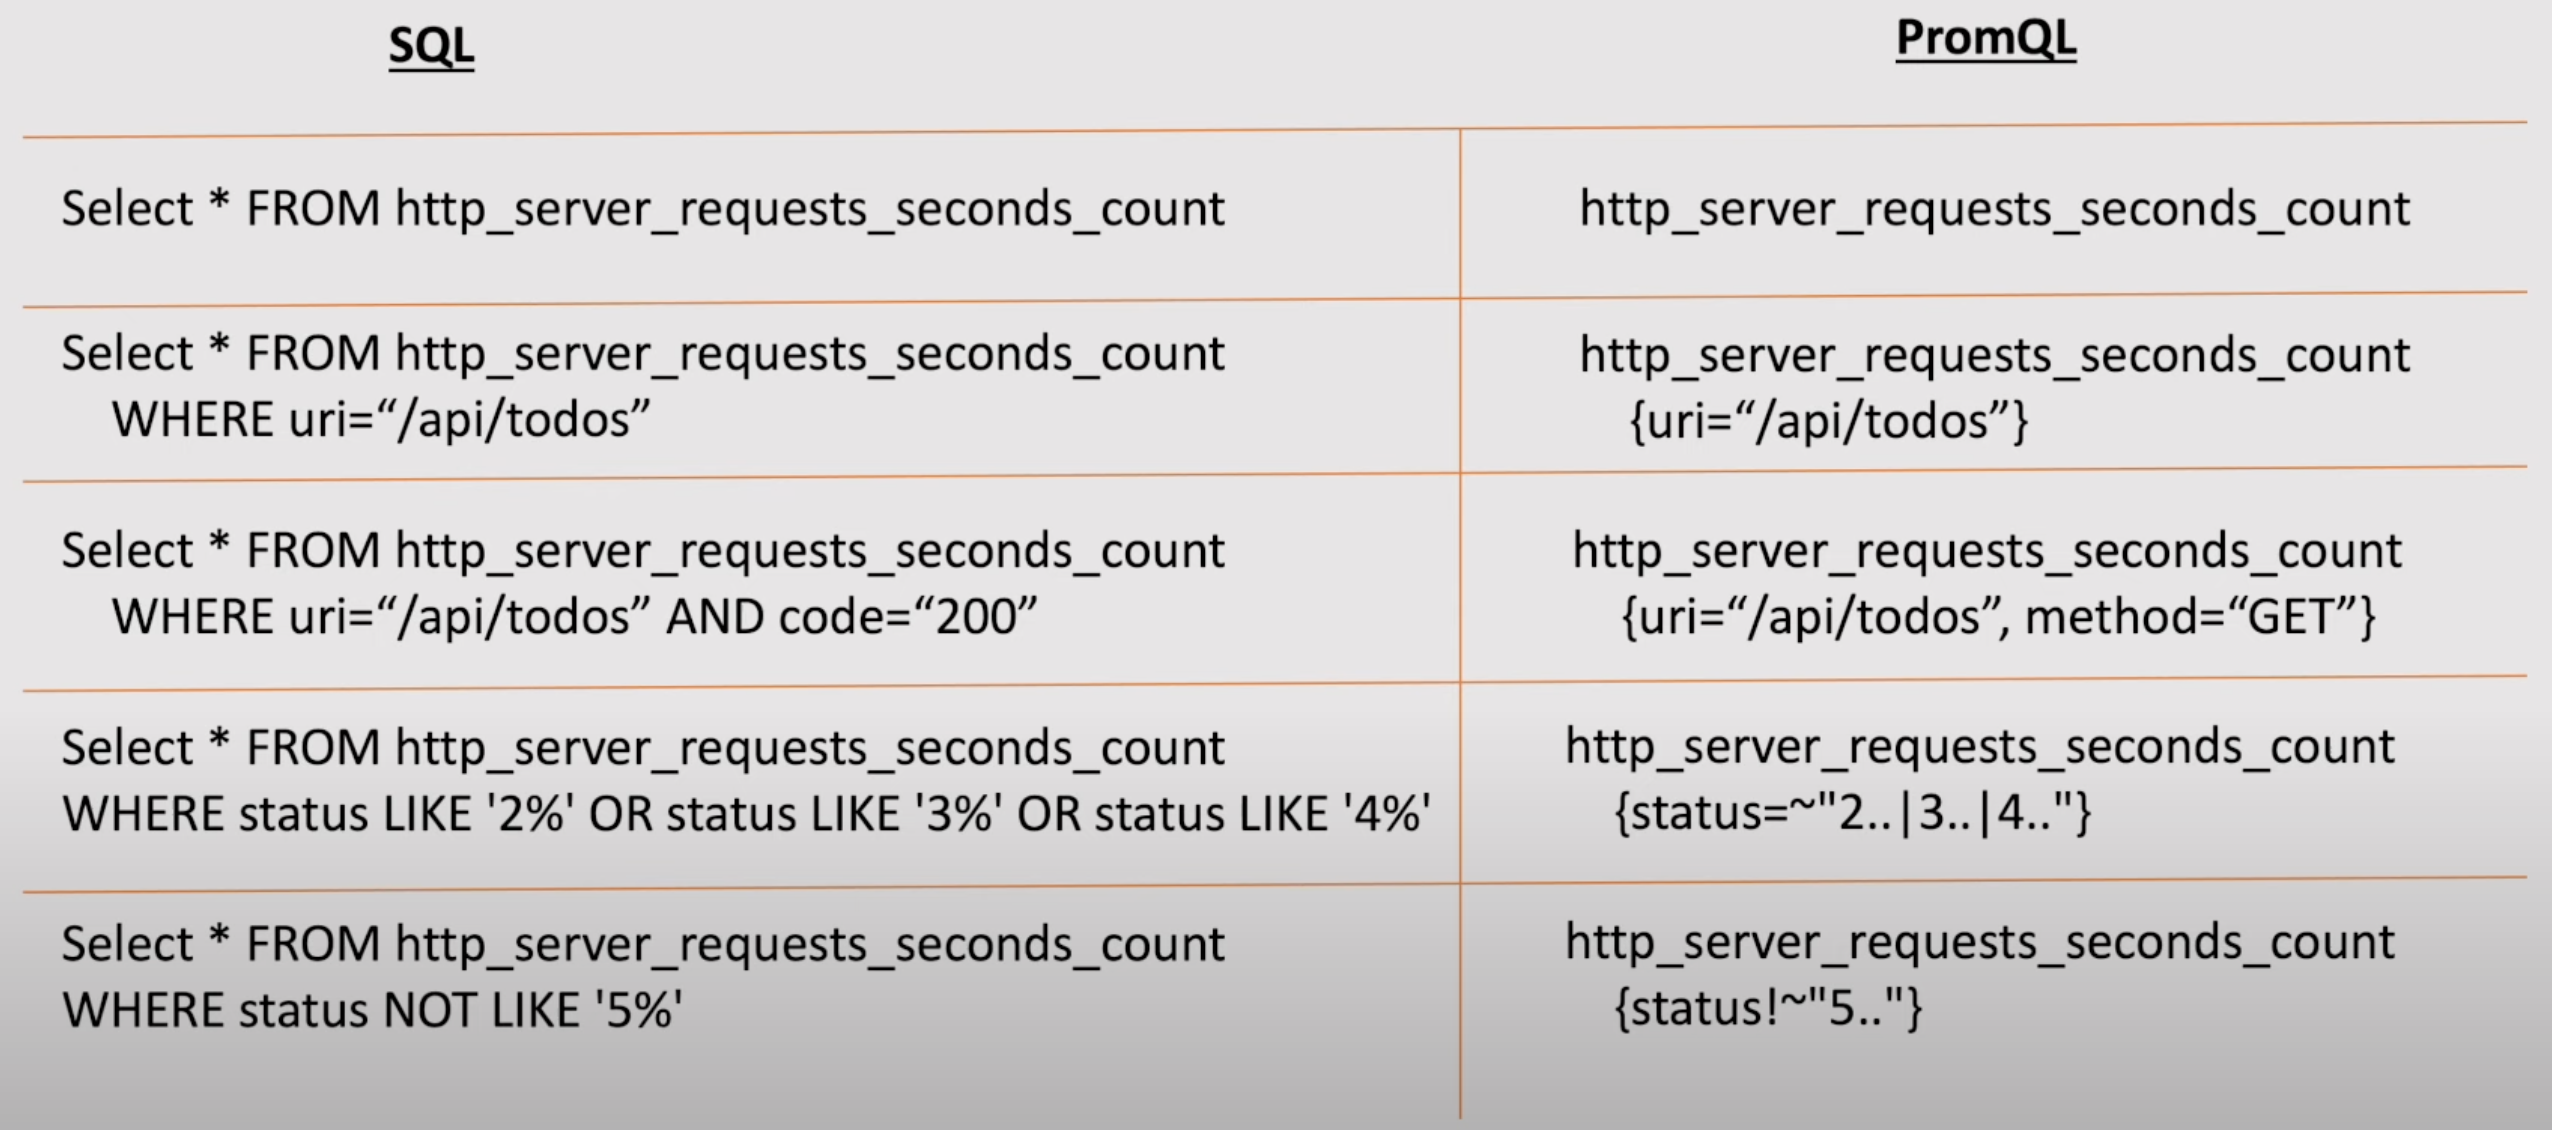
We can select, filter, and use regular expressions with PromQL.
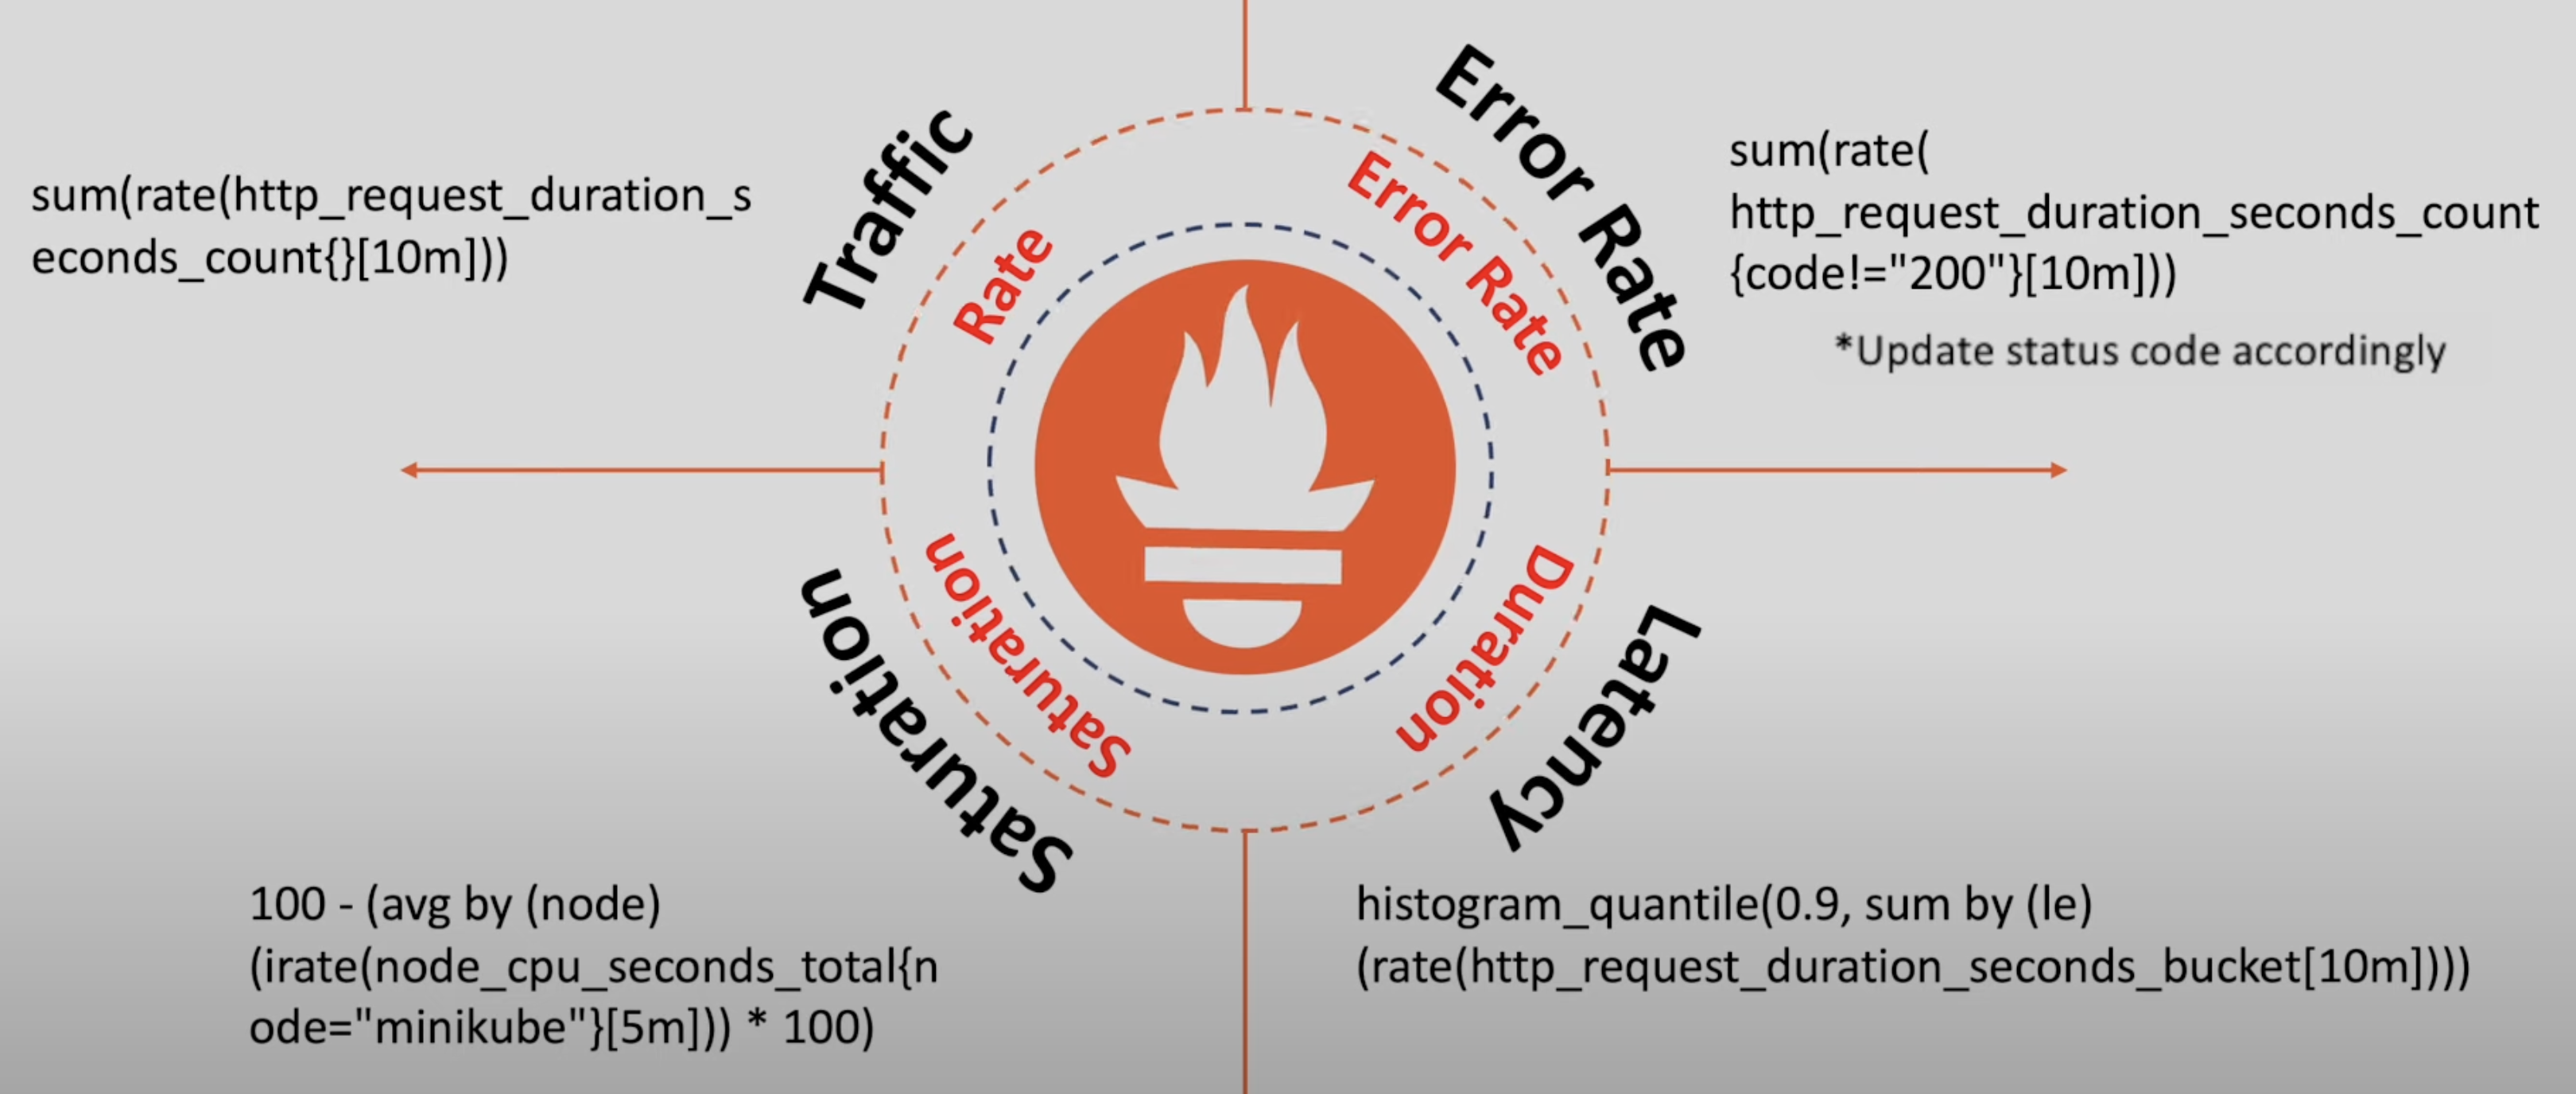
Using PromQL to monitor the 4 golden signals
PromQL Data Types
- Special operations you can apply to your Prometheus data to transform and analyse it. They’re like built-in tools that help you make sense of your metric
- Scalar: A single numerical value. For example,
10is a scalar. While some PromQL functions can return a scalar, it’s important to note that not all of them do - Instant Vector: Data point at a single moment in time. Like a snapshot of metrics right now
- Range Vector: Data point over a time period. Like a metric’s history over the last 5 minutes
Instant Vector VS Range Vector
Instant vectors show the current state, while range vectors show how things change over time.
PromQL Functions
- Aggregation:
sum(),avg(),max(),min(),count(),quantile() - Mathematical:
abs(),ceil(),floor(),round(),exp(),log() - Time series:
rate(),irate(),increase(),changes(),delta(),deriv() - Filtering:
absent(),present() - Predictive:
predict_linear(),holt_winters() - Refer to official docs for more details
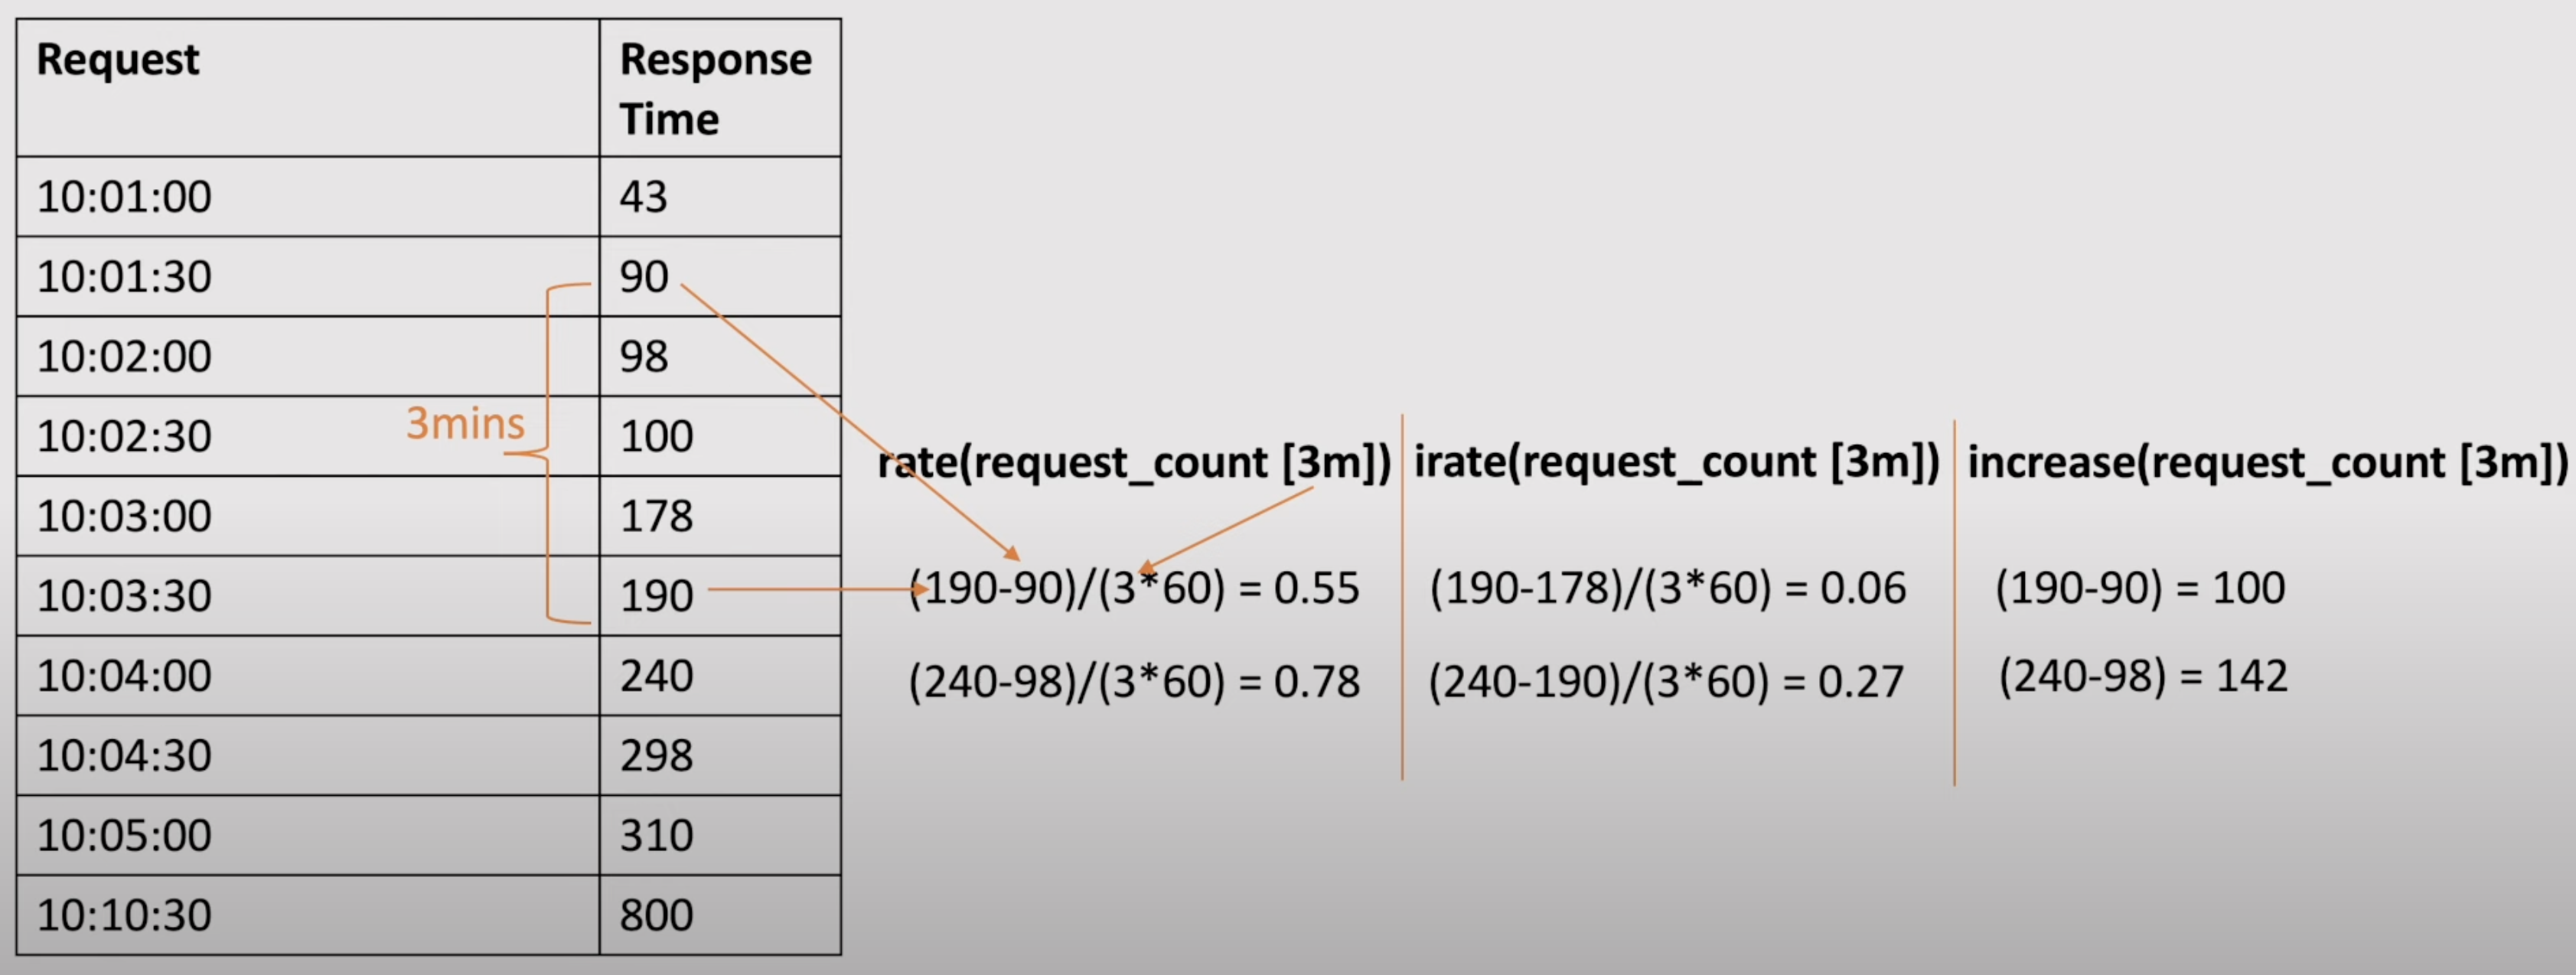
rate()vsirate()vsincrease()
The
rate()function calculates the average per-second increase over the specified time range in the range vector.The
irate()function calculates the instantaneous per-second rate of increase based on the last two data points in the range vector.The
increase()function calculates the net increase in the value of the time series in a range vector.
What is
sum(rate())?You have two web servers (
server1andserver2). Each counts HTTP requests (http_requests_total).
- server1: 100 to 200 requests in 5 seconds
- server2: 50 to 150 requests in 5 seconds.
sum(rate(http_requests_total[5m]))calculates:
- Individual rates: Each server has a rate of 20 requests/second (100 increase / 5 seconds).
- Total rate: 20 + 20 = 40 requests/second across both servers.
Therefore,
sum(rate(...))returns 40, the combined rate of all servers.
Label Matching
We use
sum by (service) (rate(http_requests_total[5m]))to calculate combined rate for a particular service.Maybe we have a frontend and a backend service, each powered by two servers. Each service handles some HTTP requests, and we want to check the status of each specific service.


