Abstract
- The standard monitoring tool used in container and microservices infrastructure
Why we need Prometheus?
Hundreds of interconnected processes serve users in these environments. If one process fails, it can trigger a cascade of failures in other processes, making it difficult to pinpoint the root cause from the end user’s perspective. Prometheus provides visibility into the application and infrastructure of these hundreds of processes, enabling proactive identification of issues instead of reactive debugging. With Prometheus, we can continuously monitor processes, receive alerts about crashes, and even configure alerts for predefined thresholds.
Prometheus Metric
- HELP attribute: Provides a clear description of the metric’s purpose
- TYPE attribute: Defines the metric’s type. Prometheus supports four core metric types:
- Counter: A cumulative metric that represents a single monotonically increasing counter. Its value can only increase or be reset to zero on restart. Examples: the number of requests served, tasks completed, or errors encountered
- Gauge: A metric that represents a single numerical value that can arbitrarily go up and down. Examples: current memory usage, temperature, or the number of active processes
- Histogram: Samples observations (like request durations or response sizes) and counts them in configurable buckets. It also provides a sum of all observed values
- Summary?: Similar to histograms, but they calculate quantiles on the client-side and expose them directly. Useful for tracking percentiles of observations like request latencies
Prometheus Configuration File
global:
  scrape_interval: 15s
  evaluation_interval: 15s

rule_files:
  - "first.rules"
  - "second.rules"

scrape_configs:
  - job_name: "prometheus"
    static_configs:
      - targets: ['localhost:9090']
  - job_name: node_exporter
    scrape_interval: 1m
    scrape_timeout: 1m
    static_configs:
- targets: ['localhost:9100']- Under
global,scrape_interval: 15sinstructs the Prometheus server to scrape target endpoints every 15 seconds.evaluation_interval: 15sruns the rules defined inrules_filesevery 15 seconds, potentially triggering alerts in the Prometheus Alert Manager - Scrape job details are specified under
scrape_configs, allowing you to override global settings likescrape_interval
Default setting for each scrape job
We have default settings like
metrics_path: "/metrics"andscheme: "http"for each job.
Prometheus Architecture

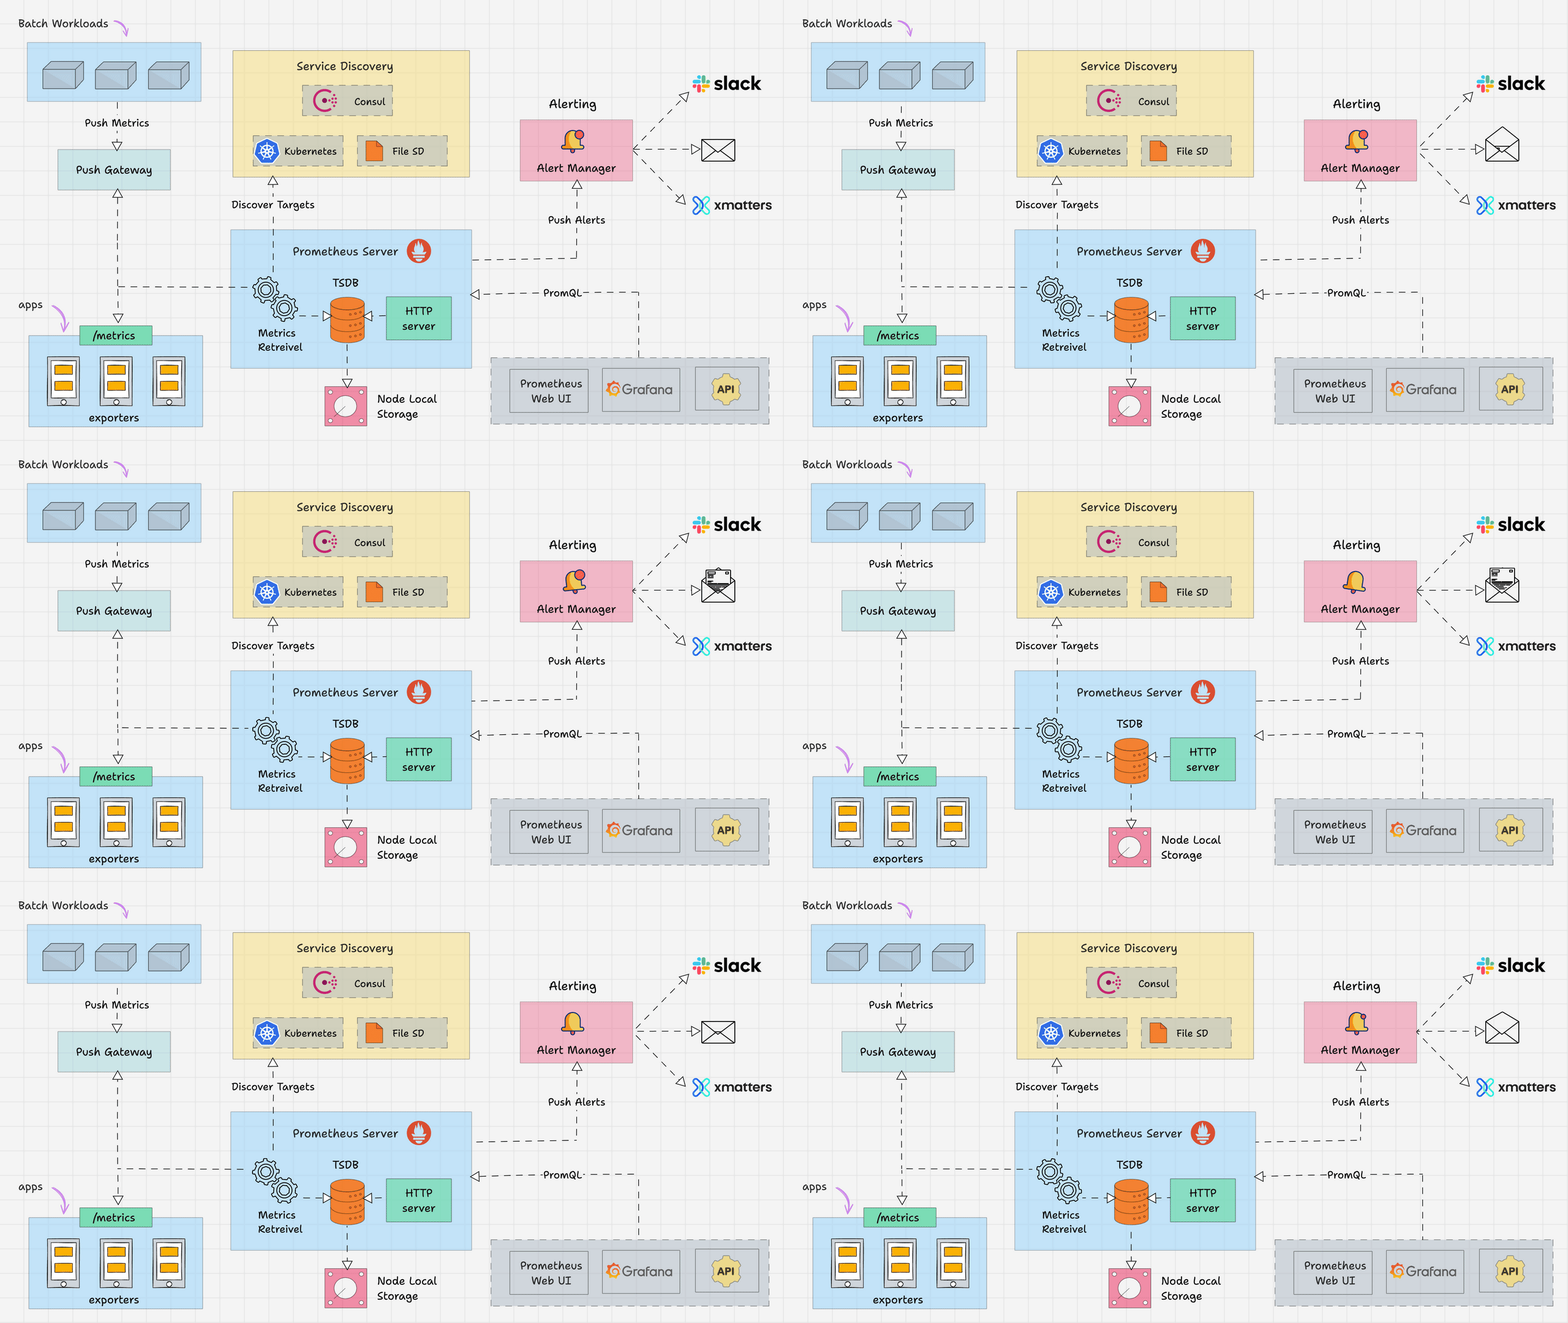
Prometheus Metric Retrieval
- The Prometheus server has a metrics retrieval component that pulls data from different targets, which are essentially various processes. This data consists of units such as CPU status, exception count, and request count. These units are considered Prometheus Metric when monitored by Prometheus. The metrics are then stored in the time-series database (TSDB)
- Prometheus also includes an HTTP server component that accepts PromQL queries, enabling integration with visualisation tools like Grafana
A pulling system
Common monitoring services like AWS CloudWatch and Datadog use a pushing approach, where all processes push metrics to a centralized collection platform. This can create a high load of network traffic, and monitoring can become a bottleneck. Additionally, we need to install a daemon on all processes to push metrics, while Prometheus only needs a scraping endpoint. The pulling approach is also a convenient way to check if a process is up.
How is Prometheus metric pulled?
Prometheus metrics are pulled by accessing an HTTP endpoint on the target. This endpoint, typically
/metrics, must expose data in a format that Prometheus understands. If the target doesn’t have a compatible endpoint, a Prometheus Exporter can be used to bridge the gap.
How does Prometheus server find the targets?
Prometheus uses service discovery services to find the targets.
Prometheus Exporter
- An exporter is a piece of software that fetches metrics from a target application and converts them into a format Prometheus understands. It then exposes these metrics at the
/metricsendpoint, where Prometheus can scrape them. You can find a list of exporters for different processes here
What if my application is running inside a container?
You can deploy the exporter as a sidecar container alongside your application container. You can also use Prometheus client libraries to instrument your application code and directly expose metrics about requests, exceptions, and other custom metrics.
Prometheus Push Gateway
- Pushgateway is a service that allows you to monitor short-lived jobs, like batch jobs or cron jobs, with Prometheus
why it's necessary:
Short-lived jobs and scraping: Prometheus typically works by “scraping” metrics from targets at regular intervals. If a job finishes before the scrape happens, Prometheus might miss its metrics entirely.
Pushgateway as a buffer: The Pushgateway acts as an intermediary. Short-lived jobs push their metrics to the Pushgateway. Prometheus then scrapes the Pushgateway, ensuring those metrics are collected even if the job has already finished.
Prometheus Alert Manager
- Prometheus evalutes the rules and push alerts to Prometheus alert manager which will fire the alerts to different notification channel like email
Prometheus Data Storage
- Prometheus stores time series data in a time-series database (TSDB) on the local filesystem, but it can also optionally integrate with remote storage systems. The data is stored in a custom time series format, so we can’t write it directly into a relational database
Important
By default, this data is stored in the
data/directory within Prometheus’s working directory. You can customize this location by modifying the--storage.tsdb.pathflag when starting Prometheus.To control how long Prometheus retains data, use the
--storage.tsdb.retention.timeflag. This flag accepts a duration value (e.g.,15dfor 15 days).
